7 Customer Feedback Metrics Every Insurance Company Should Track
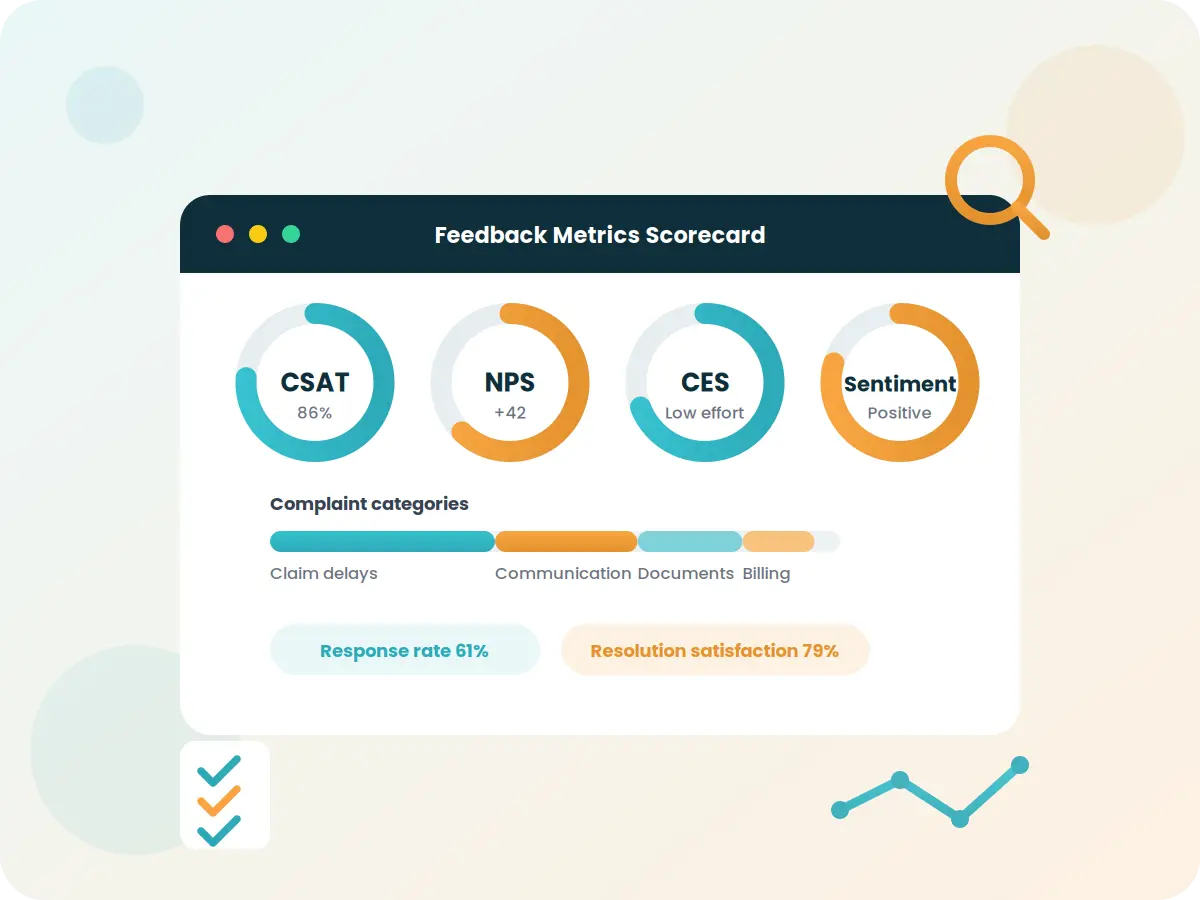
Insurance companies collect customer feedback all the time, whether after claims, policy renewals, support calls, branch visits, or digital transactions. But collecting feedback is just the first step. What really matters is what you measure. Sure, metrics like CSAT and NPS are everywhere, but using them alone doesn't tell the whole story.
If you really want to know what's going on with your customers, you need to look at a mix of satisfaction, effort, sentiment, complaint trends, and operational data. That's how insurance teams get genuine insight into what customers are dealing with, and figure out what to fix next.
Most insurance companies already track some type of satisfaction score. Maybe there's a survey after a claim, or a question about recommending the company after renewal. These numbers help, but they almost never explain what's really behind the ratings.
Picture this: you've got two branches with identical customer satisfaction scores. But dig deeper, and one gets tons of complaints about claim communication, while the other struggles with document check delays. If you just look at the big number, you'll miss what's really wrong at each one.
Instead, track a handful of different feedback metrics. Each one answers its own question, so together, they paint a much clearer picture for teams handling customer experience, claims, and operations.
The classic CSAT tells you how happy (or not) customers are with a specific interaction, maybe after a claim closes or a support call wraps up.
It gives a quick read on that one experience. If your CSAT starts tanking after a new claims process is rolled out, you'll spot signs of trouble early on.
But don't treat CSAT as the be all, end all. A lousy score means customers were unhappy, but it won't say why. That's what the written feedback is for. The real clues are usually right there.
NPS is all about loyalty: "How likely are you to recommend us to a friend or family member?"
Because NPS is easy to track and compare over time, insurance execs love it. It's a good companion to business results, helping show whether loyalty is going up or down.
That said, NPS has its flaws. Two customers might give the same score, but for different reasons. Maybe one hates claim delays, the other just dislikes the app. Without more detail, you're guessing.
That's why NPS works best with open ended questions, so customers can tell you what's behind their score.
Insurance products get complicated, and what sticks with customers is usually how hard it was to get something done.
CES measures how much effort it took. Was filing that claim or updating that policy a hassle, or was it painless?
Even if you paid a claim, the overall experience could still feel like a struggle if they had to call three times and send paperwork over and over.
Making things easier, like simple step by step instructions or less confusing forms, often boosts satisfaction, even if you haven't changed the actual product.
Not every unhappy customer gives a bad rating. Some people hand out high scores but complain in their comments. Others leave something middle of the road and point out a specific pain point.
Sentiment analysis digs through those comments and labels them as positive, neutral, or negative. That layer gives you more context than numbers alone.
As the amount of feedback grows, it's impossible to read every word. That's where tools like Surveysides come in. They use AI to scan and summarize thousands of comments, pull out the main themes, and show how sentiment shifts over time.
Count your complaints, sure, but don't stop there. Figure out what people are really complaining about.
Say you got 3,000 survey responses this month. That number doesn't mean much until you break it down:
That's way more helpful. Instead of asking, "How many complaints?", you're asking, "Which problems upset people the most?" Suddenly, you know where to focus.
Low response rate? It doesn't always mean customers are happy. Sometimes, they simply don't bother because the survey is too long or ends up in their spam folder.
If hardly anyone answers, find out why. Maybe timing's off, or maybe you need to make it shorter.
Tracking survey response over time is key. A sudden drop off after a new rollout? That matters.
And keep in mind, the best dashboard won't help if it's built on feedback from just a tiny share of your customers.
Just because a claim gets closed out doesn't mean the customer feels good about it.
What really matters is HOW you solved the problem. Were you clear with updates? Easy to reach? Did it feel fair?
Resolution satisfaction is a great way to measure the whole experience, not just speed or outcomes. In a lot of cases, honest, frequent communication matters more than just shaving off a day of turnaround time.
When you track this metric alongside CSAT, NPS, and sentiment, you get a much richer view of what the claims journey is really like from the customer's side.
| Metric | What It Measures | Best Used For |
|---|---|---|
| 👍 Customer Satisfaction Score (CSAT) | Satisfaction with a specific interaction | Claims, customer support, renewals |
| 🔑 Net Promoter Score (NPS) | Customer loyalty | Overall customer relationship |
| 🧩 Customer Effort Score (CES) | Ease of completing a task | Claims process and digital services |
| 🙂 Customer Sentiment | Emotion behind written feedback | Open-ended survey responses |
| 📚 Complaint Categories | Most common customer issues | Operational improvements |
| 📊 Survey Response Rate | Participation in surveys | Feedback program health |
| 🤝 Resolution Satisfaction | Satisfaction after issue resolution | Claims and service quality |
Putting all these metrics together gives far better context than watching just one.
1. Chasing a single score — It's easy to focus just on CSAT or NPS. They're simple and familiar, but they don't explain the "why" behind the numbers.
2. Skipping written comments — Those open ended survey answers are gold. That's where you'll find out what actually happened to the customer.
3. Reporting without follow through — Feedback isn't valuable until you use it to make changes. Don't just measure and move on. Use your reports to figure out your next moves.
You get the most value from customer feedback when you measure it well and choose the right mix of metrics. Track satisfaction, loyalty, effort, sentiment, complaint categories, response rates, and how happy people are with resolutions. That gives your team the clearest picture of which parts of the experience are working, and which need help.
As more feedback rolls in, sorting it by hand just won't work. Tools like Surveysides help insurance companies collect, analyze, and report on feedback in ways that actually drive better decisions. The tech doesn't replace your team. It just arms you with better info, so you can turn feedback into real improvements.
There’s no single “best” metric. CSAT, NPS, CES, sentiment, and complaint categories each measure their own thing. Put them together for a well rounded view.
High volume claims teams might check dashboards weekly. Broader reviews? Monthly or quarterly. It all depends on how much feedback you get and what’s going on in the business.
Absolutely. AI helps organize written comments, spot sentiment, group similar complaints, and surface trends you’d never find by reading each one yourself.
Most insurers ask for feedback after claims, renewals, customer support, branch visits, and digital interactions. Covering all those touchpoints gives the best view of the customer journey.