Google Forms Gives You Charts, Not Answers: How to Stop Wasting Hours in Excel and Start Using
AI-Powered Survey Analytics
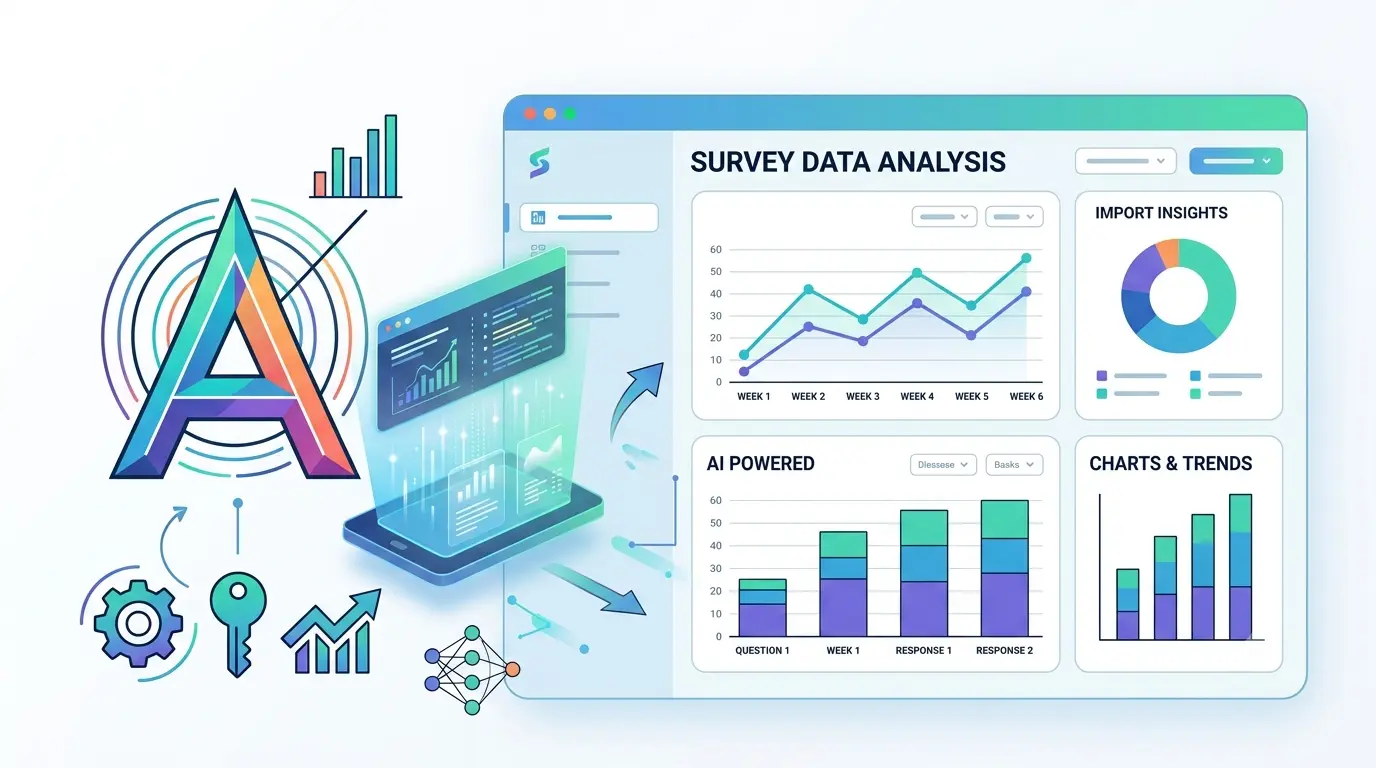
The fastest way to analyze survey data without spreadsheets is to use an AI-powered survey platform that offers automated sentiment analysis, cross-tabulation, and trend dashboards. Tools like Surveysides eliminate manual Excel work by automatically categorizing open-ended responses, segmenting data by demographics, and generating actionable insights, reducing analysis time from hours to minutes.
You have been there. You spent weeks crafting the perfect survey, launched it to your audience, and celebrated when 500 responses rolled in. Then reality hit: you are now staring at a massive CSV file, countless open-ended comments, and a basic dashboard that shows simple pie charts but zero actual answers.
If this sounds familiar, you are not alone. Thousands of marketing teams, product managers, and researchers face this exact frustration every single day. The problem is not collecting data. It is transforming that data into decisions without drowning in spreadsheets.
Let us be honest: basic free tools are fantastic for quickly gathering responses. They are easy to use and get the job done. But here is what nobody tells you: the real work begins after you hit "stop collecting responses."
What starts as a simple feedback initiative quickly becomes a time-sucking black hole:
The hidden cost is not the tool. It is your team's time. Every hour spent wrestling with spreadsheets is an hour not spent acting on insights, improving your product, or serving your customers.
Basic survey tools were built for a different era. They assume you have the time, skills, and patience to become a data analyst just to understand your own feedback. Here is where they fall short:
You asked the right questions. People gave thoughtful, detailed answers. Now what?
Manually reading 300 or more text responses is unsustainable. You will miss patterns, misinterpret sentiment, and inevitably make decisions based on the loudest voices rather than the data. Teams report spending 6 to 8 hours per survey just categorizing qualitative feedback, which is a massive drain on productivity.
Your CEO asks: "What do enterprise customers think compared to SMBs?" or "How does satisfaction differ by region?"
With basic tools, answering these questions means:
What should take 30 seconds becomes a half-day project.
The gap between collecting responses and generating insights is where modern survey platforms like Surveysides really shine. Here is how they compare across the features that matter most to research teams.
This is where the magic happens. Modern survey platforms do not just collect data. They interpret it, visualize it, and hand you actionable insights on a silver platter.
AI sentiment analysis automatically categorizes open-ended survey responses as positive, neutral, or negative, eliminating the need to manually read and tag hundreds of comments.
Imagine launching a customer satisfaction survey with 500 responses, including 300 text comments. Instead of spending an entire day reading each one, AI instantly:
The result? You know within minutes that 68% of feedback is positive, but "pricing" and "onboarding" are the top concerns among detractors.
| Feature | Google Forms | Surveysides |
|---|---|---|
| Data Export | CSV and Excel only | CSV, Excel, PDF reports plus live dashboards |
| AI Sentiment Analysis | Not available | Automatic classification of open ended responses |
| Cross Tab Reports | Manual spreadsheet work | One click demographic segmentation |
| Automated Trend Tracking | No historical comparison | Track sentiment and performance over time |
| Spam and Bot Protection | Basic only | CAPTCHA, whitelisting, expiring links |
| Question Branching Logic | Limited | Advanced conditional logic |
| Pre Built Templates | Generic only | 100 plus research backed industry templates |
| AI Generated Insights | Not available | Automated recommendations and summaries |
Direct Answer: Cross-tabulation reports allow you to filter and compare survey responses by demographics like age, location, income, or customer segment with one click. No spreadsheet formulas required.
Remember that CEO question about enterprise versus SMB satisfaction? With cross-tab reports, you simply:
No exports. No pivot tables. No formula errors. Just clear, segmented insights that reveal who thinks what and why it matters.
Trend dashboards track survey performance metrics and sentiment changes over time, allowing teams to measure progress across multiple survey cycles without manual data compilation.
One survey tells you a snapshot. Multiple surveys tracked over time tell you a story. Trend dashboards automatically:
This is how you move from reactive firefighting to proactive improvement.
To upgrade your survey analysis workflow:
(1) Audit your current tool's limitations
(2) Implement an AI-powered platform with automated sentiment analysis and cross-tabulation
(3) Shift team meetings from reviewing raw data to discussing AI-generated insights.
You do not need to overhaul everything overnight. Start with these three actionable steps:
Step 1: Audit Your Current Process
Be honest: How many hours does your team spend analyzing survey data versus acting on it? If the ratio is worse than 3:1, it is time for a change. Document the specific pain points like manual categorization, spreadsheet errors, and delayed insights so you can measure improvement.
Step 2: Implement AI-Powered Analysis
Choose a platform that eliminates your biggest time-wasters. For most teams, that means:
The goal is not more data. It is faster, clearer insights.
Step 3: Shift Your Team Culture
This is the most important step. Stop starting meetings with "Let me pull up the spreadsheet." Start with "Here is what the AI identified as our top three opportunities."
Train your team to:
Teams should stop using basic survey tools that require manual spreadsheet analysis and instead adopt AI-powered platforms that automatically generate insights, reducing analysis time by 80% and enabling faster, data-driven decisions.
Here is the truth: Your competitors are not winning because they have better surveys. They are winning because they act on insights faster.
Every hour you spend cleaning CSV files is an hour your competitor spends improving their product. Every day you delay analysis is a day you miss identifying a critical customer pain point. Every week you waste on manual categorization is a week you fall behind on innovation.
The solution is not working harder. It is working smarter.
AI-powered survey analytics are not a luxury anymore. They are a necessity for teams that want to:
Stop letting valuable insights die in spreadsheets. Join thousands of teams who have already made the switch from manual analysis to AI-powered intelligence.
Start your free trial today and discover what happens when your survey tool does not just collect responses—it delivers answers.