How to Turn 1000's of Opinions
Into Actionable Research
Insights With AI
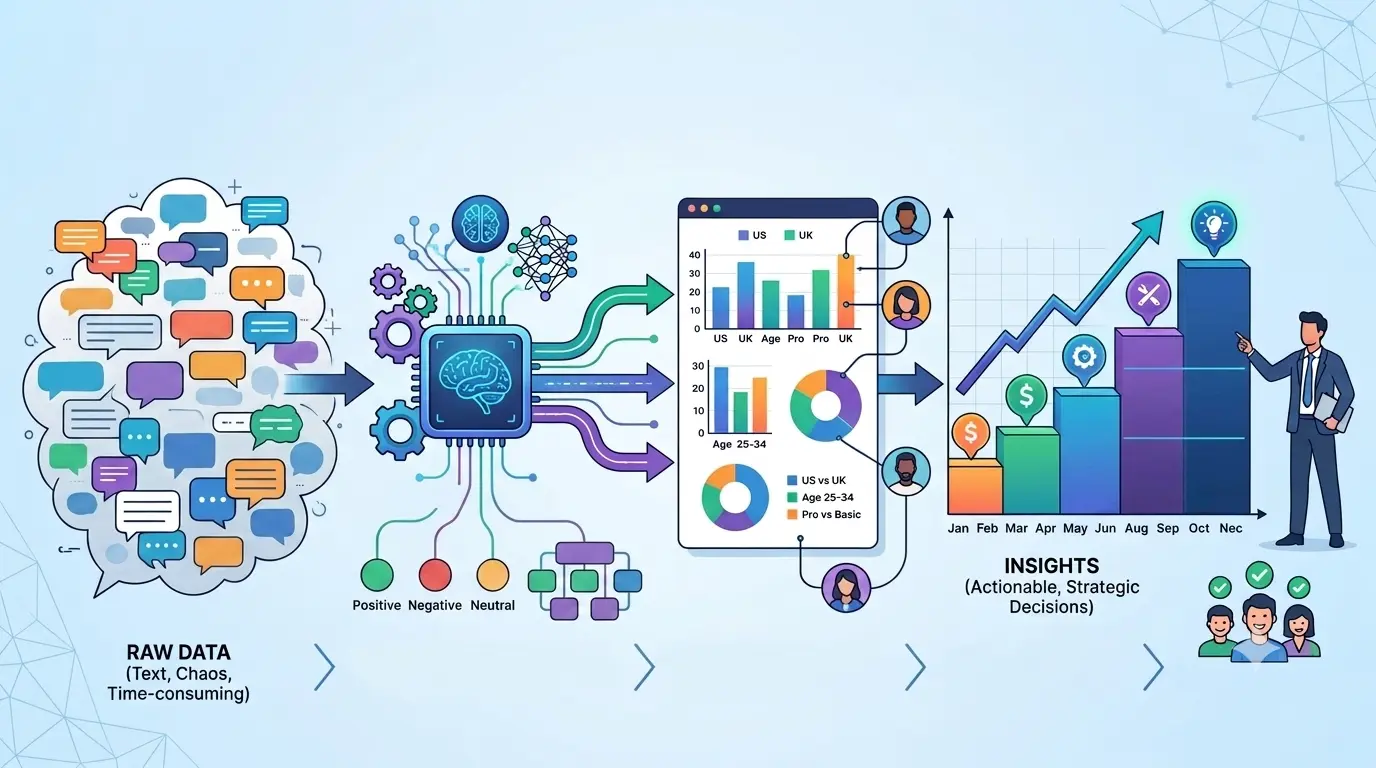
Using AI to sort and tag open survey answers is the best way to handle lots of text without doing manual spreadsheet work. Getting a thousand survey replies feels great at first. But that feeling fades fast when basic tools just hand you a giant text file. You stare at rows of words and realize that collecting the data was the easy part.
Most teams start moving this text into regular spreadsheets right away. This leads to hours of manual sorting and zero real progress on the project.
Reading hundreds of text replies by yourself is a bad idea. Human bias sneaks in when you do this. You end up skimming the long paragraphs and missing the real themes. You also focus too much on the last few comments you just read. This takes a huge toll on your team and slows down real choices. You sit there building basic charts instead of doing your actual job.
Human readers also get tired after reading just a few dozen long paragraphs. The moment you reach reply number 200, your brain looks for shortcuts. This leads to mixing up neutral comments with negative ones. The time cost makes this plan totally wrong for modern teams with tight deadlines. You might spend six to eight hours just sorting text for one project. This pulls you away from the strategy work you were hired to do.
We need a solid way to handle this info at scale. We must do this without losing the details that make text data so useful.
The first step is letting the computer models read the text. They assign positive, neutral, or negative tags to every single entry. The system then groups similar words into specific themes like pricing or shipping delays. It does this without any human help. This gives you a quick baseline of how people feel about specific topics. You do not have to guess if a comment about the checkout page is a complaint or a compliment. The program looks at the words around it and assigns the right emotional weight. You can also set up custom rules for specific product names. This keeps things tagged correctly every single time.
Once the themes are tagged, you can filter those topics by age or location. You can do this right inside your dashboard. This stops you from having to move everything to external software. You avoid building complex filters just to see what big clients think. You get a clear view of who is upset about what. This makes your follow-up actions much more targeted. For example, you might find that users in one area love the product but hate the local support hours. This helps you see if your setup process is causing issues for beginners while keeping veterans happy.
Comparing this month's tags to last month's data shows you if an issue is getting better. Basic tools only give you a snapshot of a single moment. Tracking these tags across multiple survey cycles shows the real path of customer happiness. You can finally see if that product update actually fixed the complaints you heard. This history turns isolated feedback into a clear story about your product. It lets product managers plan their work based on real feeling shifts. They do not have to just listen to the loudest voices in a single survey batch.
Computer models are only as good as the text they read. This means survey design matters just as much as the analysis tool. If you ask 40 questions in one form, people will give one-word answers just to finish. When the system tries to analyze those short replies, it will struggle to find real themes. There simply is not enough context for the program to work with. You need to use branching logic and keep your surveys short. This gives the algorithms actual, detailed paragraphs to process. When people only answer questions that apply to them, they have more energy to write thoughtful feedback. This ensures your automated analysis works with high-quality input.
The main point here is that AI handles the heavy reading and sorting. This frees your research team to focus on making real choices. You no longer have to spend your Friday afternoon coloring a spreadsheet. You just want to find out what your users want. The technology simply processes the volume so you can focus on the plan. If you want to see how this works with your own data, you can test the platform. You can watch the analysis happen in real time. It gives you the clear answers you need to move forward. Check out the available templates on the Surveysides homepage. See how much time you can save on your next research project.
Modern text models read huge amounts of writing. This helps them understand context even when people use industry slang. The system looks at the words around the slang to find the main meaning. This means it can sort technical feedback without needing a custom dictionary. You can always check a sample of the tagged replies to make sure the system is reading your terms right.
Most advanced survey platforms include built-in translation tools. These tools automatically spot the language of the reply and translate it into your main language. This happens before the system runs the sentiment analysis. This makes sure global feedback is sorted accurately and grouped with your local replies. It gives you a clear view of your customer base without needing manual translation services.
Yes, you can easily move the sorted data and sentiment tags into standard spreadsheet formats. You can also save them as PDF reports. This lets you keep a full record of the automated analysis for your company files. You still get to enjoy the speed of the visual dashboard during your actual review process. This gives your team the best of both worlds for reporting.
The automated tagging handles the first round of sorting and volume processing. But human researchers are still needed to understand the strategic meaning of the data. The technology just organizes the info so your team can spend time building real plans. They do not waste time manually reading thousands of comments. Human thought is still needed to connect survey feedback to broader market trends. The algorithm cannot see those bigger business goals.